
Car buyers often want to know which vehicles will last the longest and need the fewest repairs. The J.D. Power Reliability Rankings are one of the most trusted sources for this kind of information. But how are these rankings made? What do they really mean for you as a car owner or shopper? This article will break down everything you need to know about J.D. Power’s reliability scores, including how they collect data, what the numbers actually mean, and how to use the rankings to make smarter choices. You’ll also find out why not all “reliable” cars are the same, and what details many people miss when reading these lists.
What Is J.d. Power?
J.D. Power is a well-known American company that collects and analyzes consumer feedback on products like cars, appliances, and even insurance. Founded in 1968, it became famous for its detailed, independent surveys. For car buyers, J.D. Power surveys are especially important because they gather real-world experiences from thousands of drivers. This means the results are not just opinions of experts—they’re based on how cars perform in daily life.
How The J.d. Power Reliability Rankings Work
The Vehicle Dependability Study
Each year, J.D. Power releases its Vehicle Dependability Study (VDS). This study asks original owners of three-year-old vehicles about problems they have had over the past year. For example, the 2024 VDS looks at cars from the 2021 model year. The study covers:
- Engine and transmission issues
- Interior and exterior problems
- Tech troubles (like Bluetooth, navigation, etc.)
- Paint and trim
- Noises and leaks
Gathering Data: Who Gets Surveyed?
J.D. Power sends surveys to tens of thousands of car owners. In recent years, over 30,000 people respond each time. The survey asks about 184 specific problems in eight major categories, including features, controls, displays, and driving experience. Owners are encouraged to be honest and detailed, so the data reflects real life.
Calculating The Scores
The main score is called Problems Per 100 Vehicles (PP100). A lower score means fewer problems and higher reliability. For example, a score of 150 PP100 means, on average, owners reported 150 problems for every 100 cars. A car with a score of 120 PP100 is more reliable than one with 180 PP100.
Here’s a simplified example:
| Brand | PP100 Score | Reliability Rank |
|---|---|---|
| Lexus | 133 | 1 |
| Toyota | 144 | 2 |
| Chevrolet | 162 | 4 |
What The Scores Measure
The J.D. Power reliability score does not measure how much you like your car, how safe it is, or how it drives. It only looks at how many problems owners have experienced. This includes both big issues (like engine failures) and small ones (like a squeaky door).
What Makes The Rankings Different?
Many car reviews rely on expert opinions or short-term tests. J.D. Power rankings are special because they are based on real owner experiences over three years. This long-term view gives a clearer picture of which cars stand the test of time.
Another unique point: J.D. Power groups all types of problems together. That means a broken radio counts just as much as a dead battery. Some people see this as a flaw, but it actually gives a full picture of what living with the car is like.
Categories And Awards
J.D. Power not only ranks brands overall but also gives awards in several categories:
- Most Reliable Brand: The automaker with the lowest average PP100.
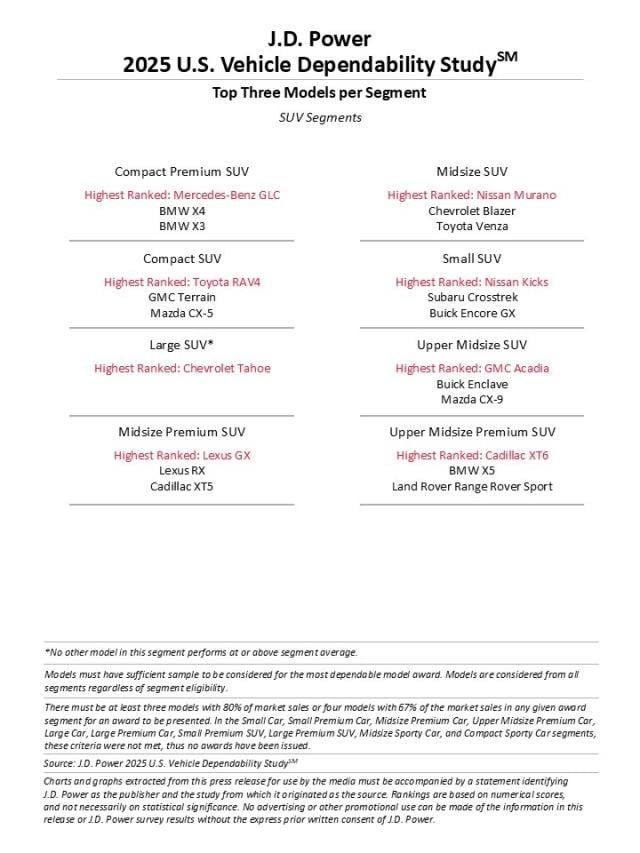
- Top Model in Each Segment: The single most reliable car, SUV, or truck in each class (compact, midsize, luxury, etc. ).
- Most Improved Brand: The brand that reduced its problems per 100 vehicles the most from the previous year.
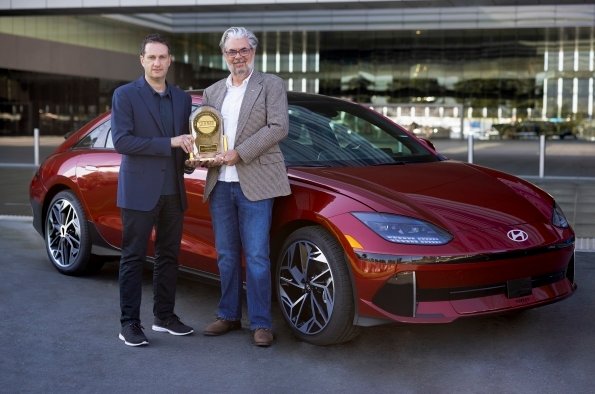
For example, in 2024, Lexus was the top overall brand, while Toyota and Buick often appear near the top as well.
Credit: www.hyundainews.com
Understanding The Data: What Really Matters
Not All Problems Are Equal
A common mistake is to treat all problems as serious. However, a car might have many small tech glitches and still be mechanically sound. Another might have a rare, major engine problem but few small issues. The J. D. Power score adds them all up, so always check the details.
Brand Vs. Model Scores
Brands get an average score, but some models may be much better (or worse) than the brand’s average. For example, a Chevrolet truck might score better than most Chevrolets overall.
Yearly Changes
Newer cars often have more tech, which can mean more problems in the first few years. This is why some older designs score higher—they have fewer new gadgets to break.
Example: Segment Leaders
To show how rankings compare within segments, here’s a sample:
| Segment | 2024 Leader | PP100 |
|---|---|---|
| Compact Car | Toyota Corolla | 120 |
| Midsize SUV | Lexus RX | 125 |
| Full-Size Pickup | Chevrolet Silverado | 140 |
How To Use The Rankings When Shopping
Step 1: Start With The Top Brands
If you want low risk, consider brands with consistently good scores. For example, Lexus, Toyota, and Kia are often reliable choices.
Step 2: Check The Model
Don’t stop at the brand. Look at the model-level rankings, especially in the segment you want. Sometimes a brand is reliable overall, but a particular model has more issues.
Step 3: Consider Your Needs
Are you more worried about tech features breaking, or about costly engine problems? Read the details in the J. D. Power study summaries, which often break down the types of issues.
Step 4: Think Long-term
A car with a good reliability score will probably save you money and stress over three to five years. However, if you plan to keep your car for ten years or more, consider also looking at older reliability studies and owner forums.
Step 5: Use The Data Wisely
Don’t just pick the car with the lowest PP100. Balance reliability with other needs like price, comfort, safety, and features. A slightly less reliable car may have other benefits that matter more to you.
Common Misunderstandings About J.d. Power Rankings
1. “a High Score Means The Car Is Bad”
Not always. Sometimes, a high PP100 score comes from small, annoying issues, not big breakdowns. Read the details before judging.
2. “all Problems Are The Same”
As mentioned above, a loose trim counts the same as a failed air conditioner. Some brands have more problems, but they are minor. Others have fewer, but more serious ones.
3. “this Year’s Winner Is Always Best”
Reliability can change from year to year. A model redesigned this year might be less reliable than last year’s, even if the brand is strong overall. Always check recent data.
4. “luxury Brands Are Always More Reliable”
Luxury brands often score lower because they have more advanced technology, which creates more chances for problems. Simpler cars often have fewer issues.
5. “j.d. Power Is The Only Source”
J.D. Power is trusted, but it’s smart to check other sources too, like Consumer Reports or government safety data. Combining sources gives a fuller picture.
Non-obvious Insights
Many buyers miss two key facts:
- Reliability scores often reflect satisfaction with dealership service. Owners who have good experiences with repairs might report fewer problems, or rate them as less serious. So, brand reputation and local dealer quality can affect scores.
- Tech features drive many problems today. Modern cars with large touchscreens, advanced safety systems, and connected apps often have more reported issues. If you prefer fewer problems, simpler trims may be more reliable, even within the same model.
Credit: www.jdpower.com
Practical Tips For Buyers
- If you want the most trouble-free ownership, look for models with low PP100 and simple equipment.
- For used cars, check both the J.D. Power ranking for that year and online owner forums.
- Don’t ignore recalls and safety ratings—reliability is just one part of the ownership experience.
How J.d. Power Compares To Other Rankings
J.D. Power is not the only group testing reliability, but it is unique because of its scale and focus on three-year ownership. Other sources, like Consumer Reports, use a mix of owner surveys and expert tests. Government sources may focus more on safety or recalls.
Here’s a comparison:
| Source | Data Type | Focus |
|---|---|---|
| J.D. Power | Owner surveys | Problems at 3 years |
| Consumer Reports | Owner reports + expert tests | Reliability + owner satisfaction |
| NHTSA | Recalls, complaints | Safety issues |
For more about the J.D. Power process, see the Wikipedia: J.D. Power page.
Credit: www.hyundainews.com
Frequently Asked Questions
What Does Pp100 Mean In J.d. Power Rankings?
PP100 stands for “Problems Per 100 vehicles.” It shows how many issues owners reported for every 100 cars. A lower number means higher reliability.
How Often Are The J.d. Power Reliability Rankings Updated?
The main rankings come out once a year, usually in February, covering vehicles that are three years old.
Are J.d. Power’s Results Trustworthy?
Yes, the rankings are based on large surveys of real owners. However, it’s still wise to check other sources and read the details behind the scores.
Do Luxury Cars Always Score Higher In Reliability?
Not always. Luxury cars often have more advanced features, which can mean more reported problems. Brands like Lexus are exceptions, but many luxury brands score average or below average.
Should I Buy Only The Top-ranked Car?
Not necessarily. The top car for reliability may not fit your needs for comfort, price, or style. Use the rankings as one part of your decision, not the only factor.
J. D. Power reliability rankings are a helpful tool for finding a dependable car, but understanding what’s behind the numbers is key. If you read the details and use the scores wisely, you’ll be more confident in choosing a vehicle that will serve you well for years.